Pump Curve Charts Explained
The pump performance curve helps you select the right pump for the specific needs of your application. Browse Our PumpsContact Us For a Fast QuoteWhat is a Pump Curve
Reading a pump curve will tell you how a pump will perform in regards to pressure head and flow. A pump composite curve cover will include the pump performance curves, horsepower curves, and NPSH required. A curve is defined for a specific operating speed (rpm) and a specific inlet/outlet diameter.
A pump curve for the EDDY Pump HD-10000 is pictured below.

Pump Head – Pump Pressure
On our example chart main vertical Y-axis we have head pressure and on the horizontal X-axis, we have the flow rate. Basically, the head is pressure and the flow rate is how much water the pump can move.
Head is useful because it evaluates a pump’s capacity to do a job. Most pump applications involve moving fluid to a higher level. If you have to pump a liquid up 30 feet and your pump doesn’t have at least 30 feet of head, then there is no chance it will work. Your pump will need at least 30 ft. plus the friction loss to get the required flow at the required discharge point.
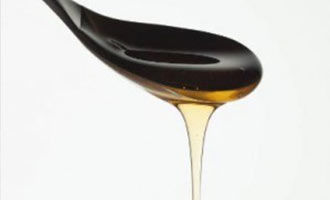
Head pressure will vary with the fluids you are pumping. For example, we have bought a pump that can provide 150 feet of head (45.72m). Then we use it to pump water, the pressure will be around 54.25 psi (4.485 bar). But if we use it to pump milk then the pressure will be around 56.15 psi (4.64 bar). The pressure will vary depending on the liquid used but the height it can be moved by the pump will remain the same.

Pump Flow Rate
A pump’s flow rate is how much fluid it can transport within a given time. Knowing this, you can assess if an existing system is working efficiently or not. If you know the flow rate you should be achieving and yet your system is not performing, then you can take the necessary action to fix the issue.
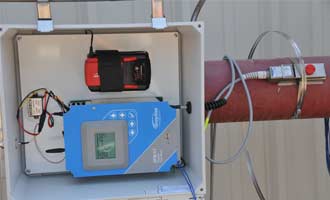
The best way to read your flow rate with a flow meter. It’s a simple device that can measure the amount of fluid passing through a pipeline. Attach this to your discharge pipe, as close as possible to your pump and it should give you a reliable reading of your flow rate. It is important to outfit your system with meters to check on its performance over time. Years on someone else will make changes to the system and will be able to read the meters added to the system to correct any problems introduced to the system by their changes.

Performance Curve
The performance curve will be different for each pump and some will suit your system needs better than others. You will usually see on the chart as the flow rate increases, the head pressure decreases.
When selecting a larger pump, as long as your system requirements are on or below the performance line, the pump can be considered. Performance can be changed on existing pumps by using smaller impellers or variable frequency drives to better suit your requirements.
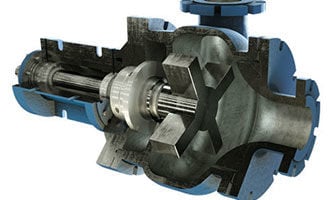
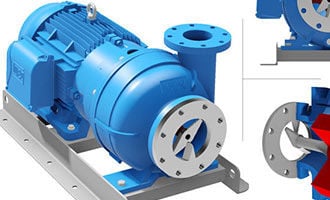
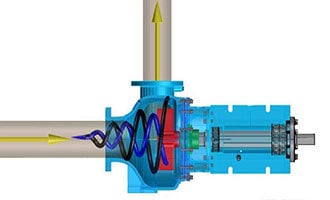
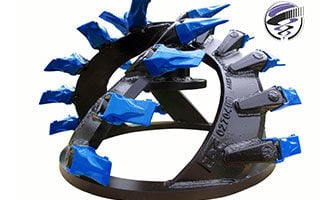
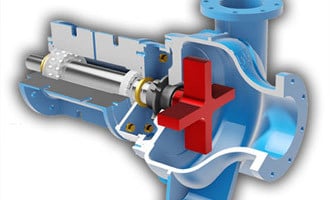
Rotor/Impeller Size
The rotor or impeller is the core part and it converts the mechanical energy into pressure energy which directly determines the transport capacity and the hydraulic performances of a centrifugal or slurry pump. The fluid enters the impeller through the eye then it is pushed by the vanes/blades as the fluid passes the channel.
On most centrifugal-style pumps, the impeller size can be changed as needed. The diameter of the impeller will change how much water can be moved. On some pump performance charts, you will see multiple performance curves which give the details of the pump for different diameter impellers. The diameter of the impeller will be listed at the end of the line. This gives you a powerful variable that you can change to get to peak performance for your application.
Pump Power Considerations
BHP (brake horsepower) curves indicate the horsepower required to operate a pump at a given point on the performance curve. The lines on the horsepower curve correspond to the performance curves above them and, like the head-flow curve, the different lines correspond to different impeller sizes. This information is useful to ensure that the selected motor is the correct size and is also used when calculating power consumption costs.
When sizing a motor, the total current and future demand should be considered to make sure that the motor is the correct size. The motor is typically sized not at the peak efficiency point but by the maximum power draw that will be needed. It is common practice to size the motor for the End of Curve (EOC) horsepower requirements.
Pump Efficiency
The pump performance curve also provides efficiency curves. These efficiency curves intersect with the head-flow curves and are labeled with percentages. The efficiency varies throughout the operating range.
Some curves will also mark the Best Efficiency Point (B.E.P.). This is the point on a pump’s performance curve that corresponds to the highest efficiency and is usually between 80-85% of the shutoff head. At this point, the impeller is subjected to minimum radial force promoting a smooth operation with low vibration and noise, leading to less maintenance and longer equipment life.

Rotational Speed
Some pump manufacturers will provide separate charts for operating the pump at different rotational speeds. You can then compare the performance to get a close match and then find an electrical motor that will suit this. Typically, higher rotational speeds lead to more service and maintenance so where possible it’s good practice to choose a lower speed pump that meets your system’s requirements.
NPSHr Curve
The third part of the pump curve is the Net Positive Suction Head Required (NPSHr) curve. The NPSHr curve provides information about the suction characteristics of the pump at different flows. For more information on NPSH, please see here.
The x-axis is still measured in inflow units (gallons per minute), but the y-axis is now measured in feet of NPSHr. Each point along the curve identifies the NPSHr required by the pump at a certain flow to avoid cavitation issues that would be damaging to the pump and would have a negative impact on overall pump performance.
The NPSH is the minimum pressure that must be available at the suction inlet of the pump to overcome the entrance losses and avoid cavitation.
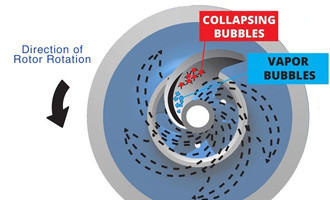
Cavitation is where the pressure at the inlet of the pump reaches a low enough point that the water begins to boil, this creates rapidly expanding and collapsing air bubbles which will gradually destroy the surface of the pump and casing, requiring a new pump.

Pressure also plays an important role. Since pumps rely on creating patterns of high and low-pressure levels to move materials through the system, low-pressure areas can suddenly cause liquids to spontaneously boil. By ensuring the system always provides enough NPSH, pressure levels stay above the cavitation point and vaporization bubbles out of the pump.
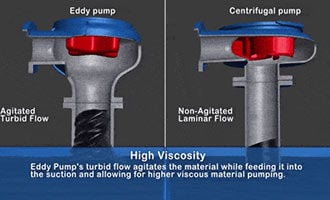
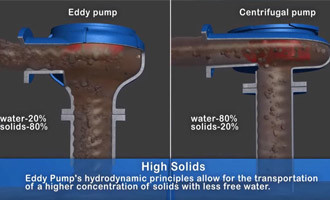
Why EDDY Pumps Are Better – Highlights

This video shows how EDDY Pump outperforms centrifugal pumps when pumping high solids abrasive, viscous or corrosive slurries.
Why EDDY Pumps Are Better - Highlights
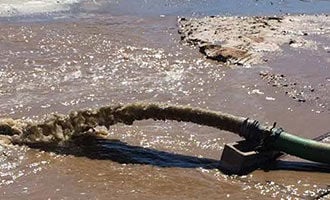
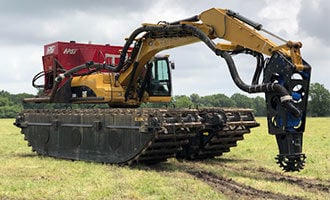
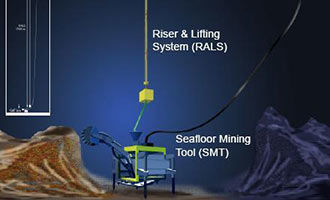
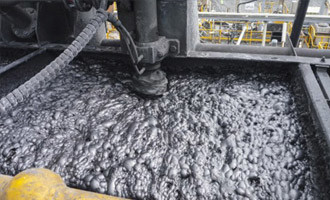
This video shows how EDDY Pump transports high slurry and abrasive materials. Featured dredge pump equipment includes the Remote Operated Subdredge, Diver Operated Pump and a Excavator Attachment Dredge Pump.